
Consumer insights at unparalleled speed + scale
Sense360 by Medallia
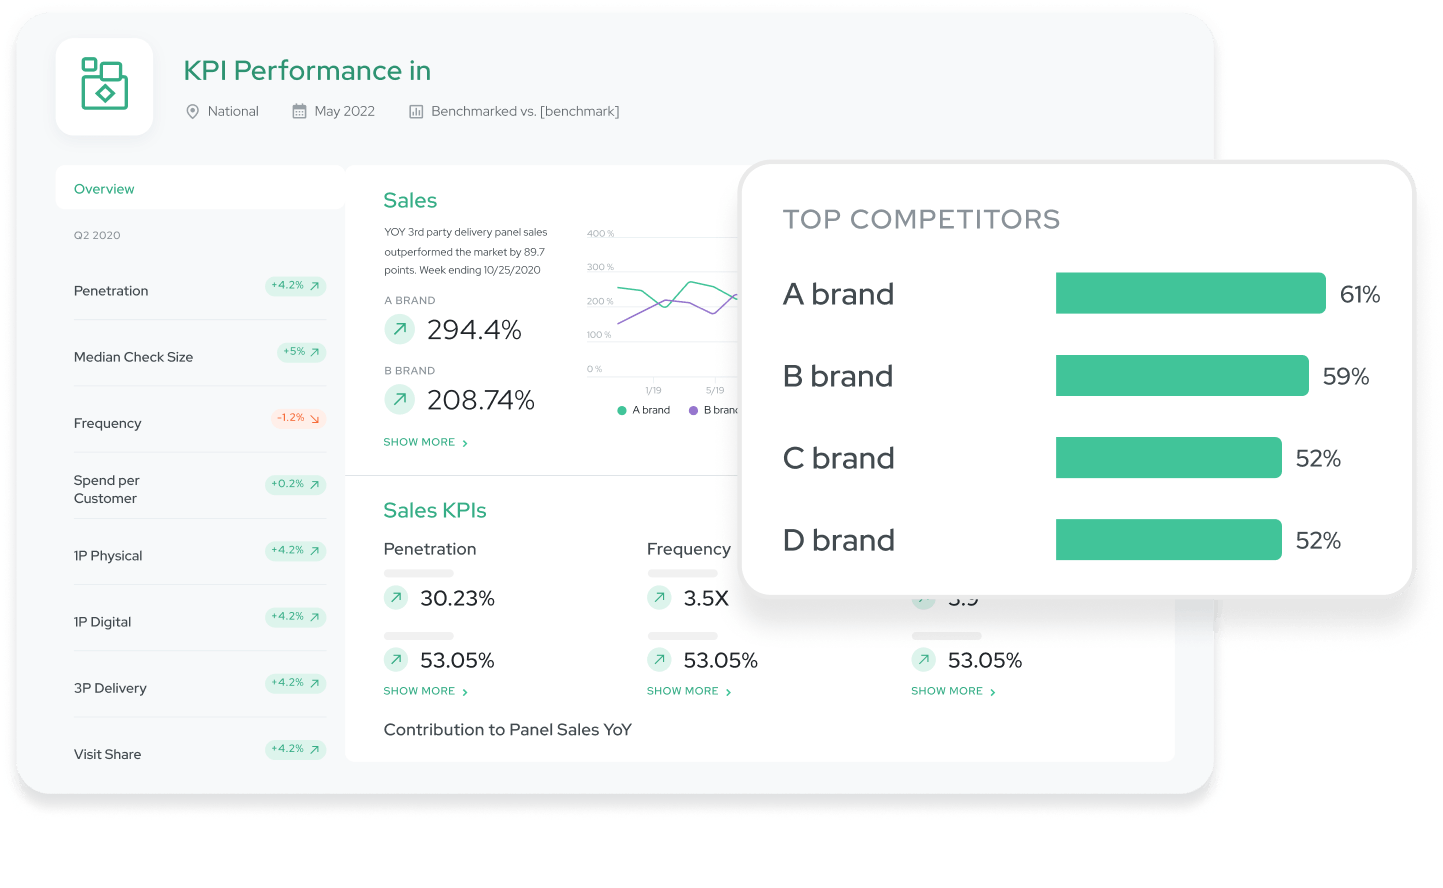
Gain a 360-degree view of consumer behavior
Sense360 by Medallia is a first-of-its-kind, self-service insights platform for retail and restaurant brands.
Access simple dashboards for a one-click analysis of massive independent datasets (transaction, foot traffic, and survey panels) to see where, how, and why consumers spend their time and money - with your business and with your competitors.
Customize your competitive set, access easy-to-read dashboards, set up automatic exports, and more - so you get instant answers to your most important questions.
“Our partnership with Sense360 and their team is a game-changer because it allows us to make better business decisions faster. We can now see competitive shifts in granular detail, including by Daypart and DMA, in nearly real-time.”
Director of Consumer Insights, Jack in the Box
Understand consumer behavior through multiple lenses
Transactions
Sense360 analyzes spend data from the debit and credit cards of 5 million U.S. consumers. Gain deeper insight into the state of your business by understanding how much consumers are spending at your brand, your competitors, online shopping, and via third-party delivery.

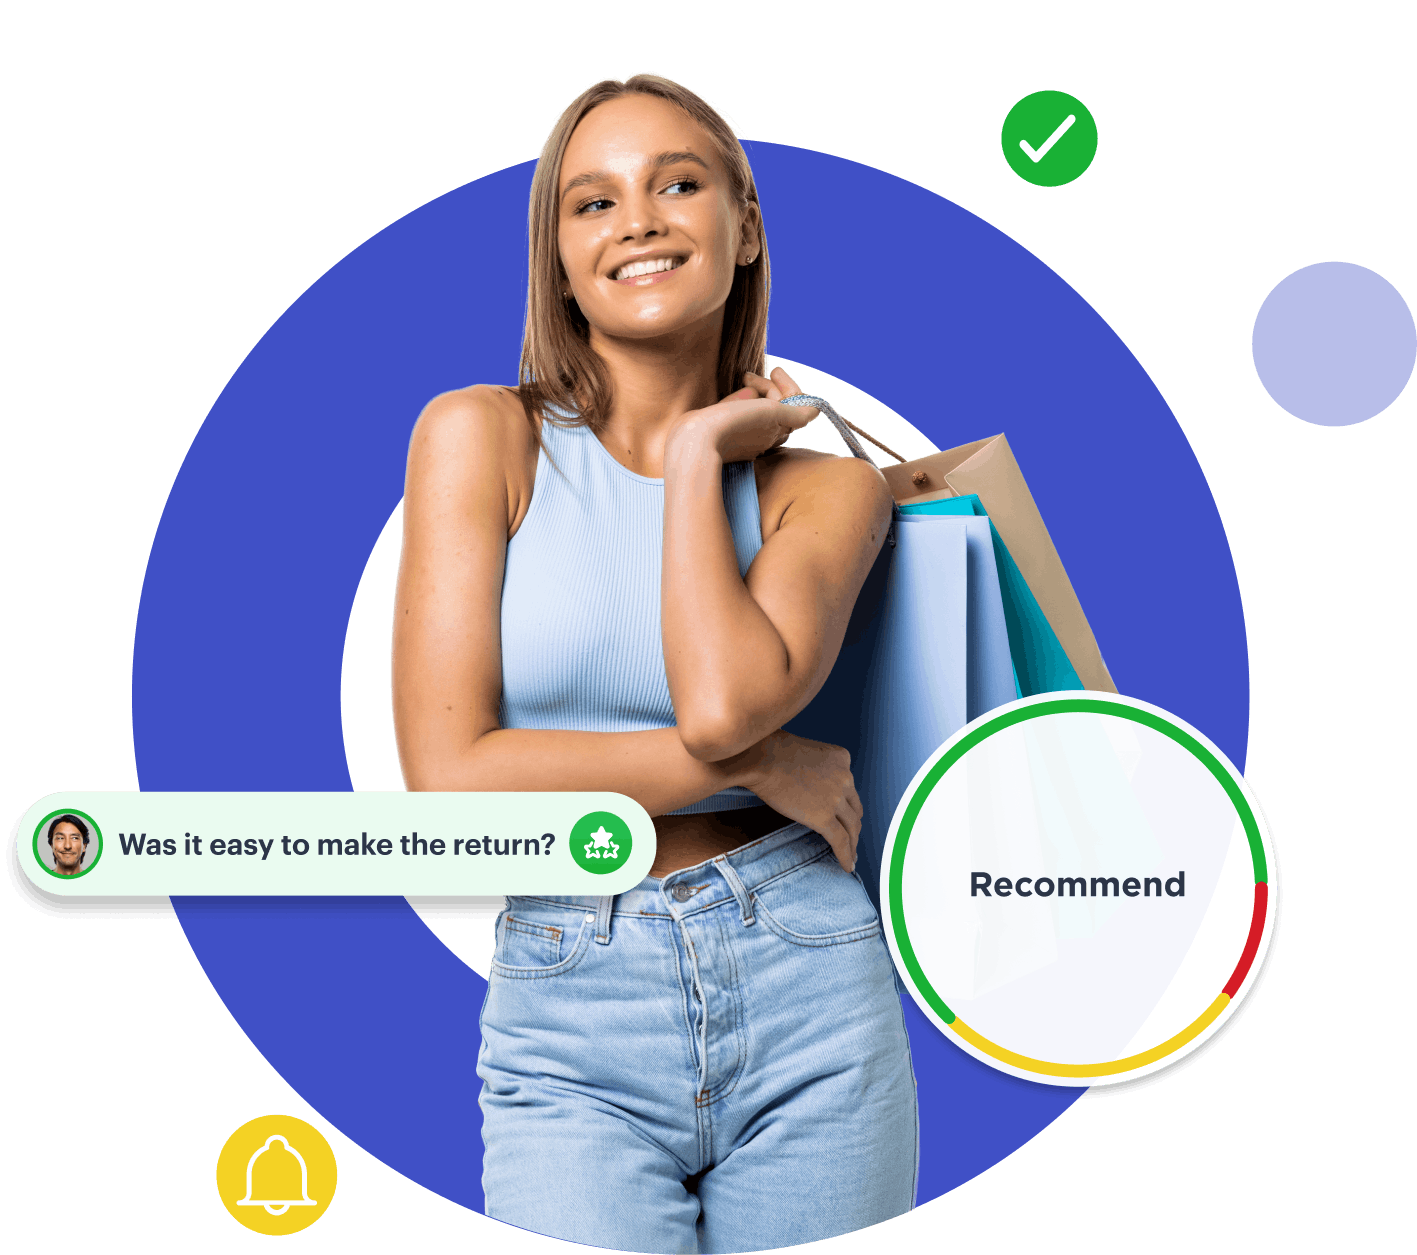
Surveys
Survey customers from our proprietary survey panel – the largest visit-based panel in the U.S. – immediately after they visit your website or brick & mortar location (or a competitor’s) to find out why and how they make decisions. Leverage our off-the-shelf syndicated survey datasets or conduct custom research.
Foot Traffic
Use mobile phone location/sensor data to track the in-store visits of millions of opted-in, anonymized U.S. consumers - 24/7. Understand trends in where consumers go and which competitors are gaining market share, with granular cuts like DMA and Daypart.
Questions, meet answers
Our expert analysts partner with your team to understand your business, research your questions, and provide in-depth analyses using multiple proprietary datasets.
Sense360 helps you answer questions like:
- Are we capturing fair share? Are our customers reducing trips and going to specific competitors?
- Why are our customers leaving us? Is it offers, price, products, experience? Who are they and how do we win them back?
- Which occasions are we winning? Where do we fall in the shopper journey? Who are your core customers, and which represent the largest opportunity?
Solutions and Analyses for every need
Take the analysis into your own hands with our self-serve dashboards and research tools, or lean on market research experts to do the heavy lifting for you. Our team of data scientists and analysts can answer your toughest questions with custom trackers and research projects.
Dashboards designed to give you answers - not just data

See the impact through the noise with automatic identification of the biggest drivers of performance. With one click, analyze multiple datasets to flag the most meaningful insights. Designed to fit into your workflow with easy-to-read dashboards, customizable subscriptions that deliver new insights straight to your inbox, and Powerpoint/Excel exports with editable charts that enable you to socialize insights quicker.
Survey capabilities & methodology

Our unique visit-based survey methodology means you get more accurate and cost-effective answers – to complement more traditional surveys. Trigger surveys based on observed visits to specific stores/websites for feedback immediately after real-world behaviors. At the end of each project, you receive actionable insights, not just data, in the format that works best for you.
Robust syndicated trackers across hundred of brands

- The Retail CX Benchmark syndicated survey collects feedback from validated visitors of top retail brands (in-store and online) in the U.S. across 23 different attributes including satisfaction, trip drivers, non-buyers, and categories shopped/purchased.
- The Restaurant Brand Perceptions post-visit survey tasks validated visitors with rating 180 restaurant brands across 37 attributes like value, menu, experience, and more.
- The Restaurant CX Benchmark collects feedback from visitors of dozens of top QSR and Fast Casual brands across attributes like satisfaction, trip drivers, value, menu, ordering channel, delivery experience, and more.
Expert support from analysts & data scientists

An extension of your team. Your analytics consultants will feel like new hires on your team, except they don’t require any ramp-up time on the datasets or the industry.
A dedicated team of analysts for all of your custom research. All of your research projects will be designed and executed by a consistent set of analysts, which helps you avoid vendor ramp-up periods (including prolonged legal/approvals).
Better insight based on a more complete view of customer behavior

- Softness Analysis - If your sales are declining in specific markets, we’ll discover exactly why customers are visiting less, spending less, or perceiving less of your brand.
- Migration Analysis - Identify changes in purchase frequency, whether you are acquiring or losing customers to competitors, and the demographics of different customer groups.
And many more including LTO and Third-Party Delivery analysis. Tell us your business questions, and we’ll design a research plan to discover the answers.

Talk to a market research expert


Experience 101
Platform
Company
Resources
Copyright © 2024. Medallia Inc. All rights reserved.
© Medallia®, the Medallia logo, and the names and marks
associated with Medallia’s products are trademarks of Medallia and/or
its affiliates. Net Promoter, Net Promoter Score and NPS are
registered trademarks of Bain & Company, Inc., Fred Reichheld and
Satmetrix Systems, Inc. All other trademarks are the property of their
respective owners.